Finance & Analytics Portfolio

Kemish Dominguez

Finance major at BYU-Idaho with a Business Analytics minor and a Data Science Certificate. I use Excel, Power BI and SQL to turn raw data into clear recommendations, and I'm looking for finance, accounting and analytics opportunities.

Available for internships April–August 2027

Kemish Dominguez
Email
dom23017@byui.edu
LinkedIn
kemish-domínguez-reyes
Location
Idaho Falls, ID · open to relocation
Languages
English, Spanish (native)

Power BI

2 dashboards

DAX, data modeling, navigation

Excel

2 models

Lookups, forecasting, charts

SQL · MySQL

1 analysis

CTEs, window functions

Finance & Accounting

Budgets & reporting

Cost tracking, variance analysis, investment risk

Projects

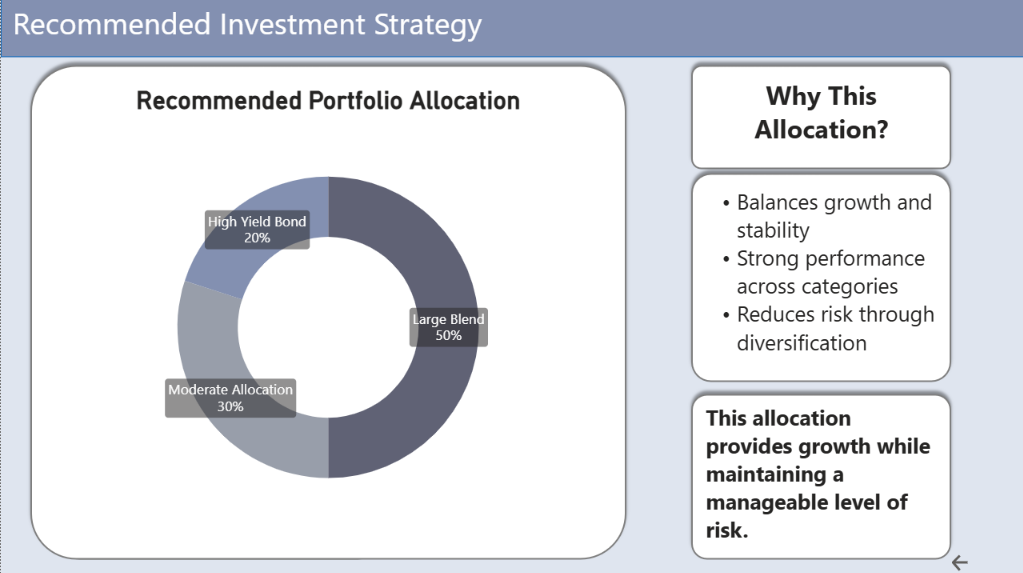
Recommended portfolio allocation: 50% Large Blend, 30% Moderate Allocation, 20% High Yield Bond

Recommended investment strategy

Project 1 · BA 315 · Business Analytics · Final project

Retirement Investment Strategy

Power BIDAXRisk analysis

Goal

Recommend how a family (ages 45 and 42, five children, $25,000 saved) should invest for retirement while keeping risk manageable.

What I did

Analyzed about 9,900 mutual funds in a six-page Power BI report. I grouped funds by risk level, compared 1-, 3-, 5- and 10-year returns, and measured return per unit of risk.

Result

Recommended a diversified mix of 50% Large Blend, 30% Moderate Allocation and 20% High Yield Bond with six specific funds, at a 16.1% three-year return and moderate risk.
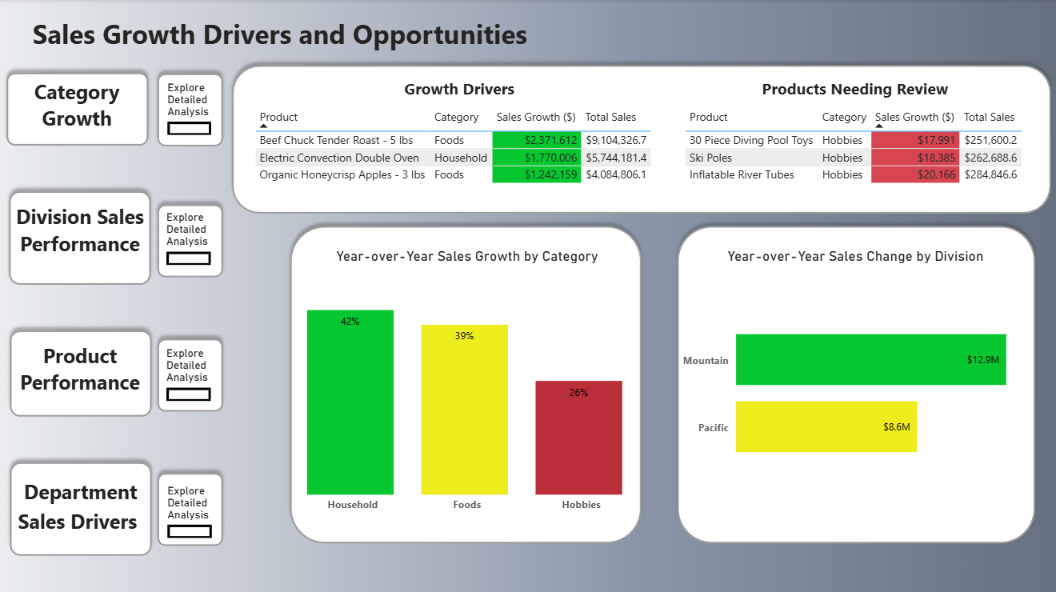
Sales growth drivers and opportunities summary page

Analysis summary with navigation to each page

Project 2 · BA 315 · Business Analytics

Retail Sales Growth Drivers

Power BIInteractive dashboardMap visual

Goal

Find out what was driving growth for a retailer with $81.2M in sales across 13 western states.

What I did

Built a five-page interactive dashboard with navigation buttons, filters and a map, comparing growth by category, division, product and department from 2019 to 2021.

Result

Household led growth at 42%, driven by Kitchen (45%) and Living Room (38%), while Hobbies declined. I recommended expanding Kitchen and Living Room products and reviewing the Outdoors department.

Repeat buyer within 30 daysAll other customers
$0 $1,000 $2,000 $3,000 Jul '01 2002 2003 2004 2005 Mid-2003: average sale drops ~80%

Average sale by month for each customer group, July 2001 – December 2005

WITH purchase_dates AS (
    SELECT DISTINCT customer_key, order_date
    FROM sales
),
ranked AS (
    SELECT DISTINCT customer_key, order_date,
        ROW_NUMBER() OVER (PARTITION BY customer_key ORDER BY order_date ASC) AS date_ranks
    FROM purchase_dates
),
first_purch AS (
    SELECT customer_key, order_date AS first_purchase
    FROM ranked
    WHERE date_ranks = 1
),
second_purchase AS (
    SELECT customer_key, order_date AS second_purchase
    FROM ranked
    WHERE date_ranks = 2
),
customer_group AS (
    SELECT fp.customer_key,
        CASE
            WHEN sp.second_purchase IS NOT NULL
             AND DATEDIFF(sp.second_purchase, fp.first_purchase) BETWEEN 1 AND 30
            THEN 'multiple_purch'
            ELSE 'control'
        END AS purchase_group
    FROM first_purch fp
    LEFT JOIN second_purchase sp ON fp.customer_key = sp.customer_key
)
SELECT ROUND(AVG(s.sales_amount)) AS average_sales,
    MONTH(s.order_date) AS month,
    YEAR(s.order_date) AS year,
    purchase_group AS category
FROM sales s
JOIN customer_group cg ON s.customer_key = cg.customer_key
GROUP BY MONTH(s.order_date), YEAR(s.order_date), purchase_group
ORDER BY category DESC, YEAR(s.order_date), MONTH(s.order_date);

Project 3 · BA 300 · SQL for Analysts

Customer Repeat-Purchase Analysis

MySQLCTEsROW_NUMBER()CASE WHEN

Goal

Find out whether customers who make a second purchase within 30 days are more valuable than other customers.

What I did

Wrote a query with five CTEs and a window function to find each customer's first and second purchase dates, split about 25,000 customers into two groups with CASE WHEN and DATEDIFF, and compared their sales by month.

Result

Only 14% of customers came back within 30 days, and their average sale was 18% lower. Quick repeat purchases did not mean higher-value customers, so order size deserves as much attention as repeat visits.

GroupCustomersAvg. saleTotal sales
Repeat within 30 days3,525$416$8.49M
All other customers21,458$510$57.63M
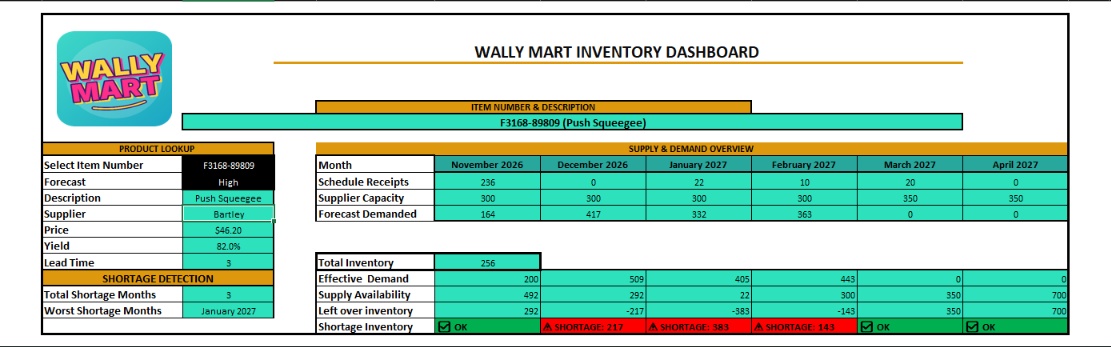
Wally Mart inventory dashboard flagging shortages in December, January and February

Pick an item number and the dashboard fills in the rest

Project 4 · BA 215 · Business Spreadsheet Analysis

Inventory Shortage Dashboard

ExcelLookup formulasConditional formatting

Goal

Help a store see product shortages before they happen.

What I did

Built an Excel dashboard where you choose an item number and it pulls the supplier, price, yield and lead time, then compares six months of supply against forecast demand.

Result

Shortages are flagged automatically. For the push squeegee it found 3 shortage months, the worst in January 2027 at 383 units short.

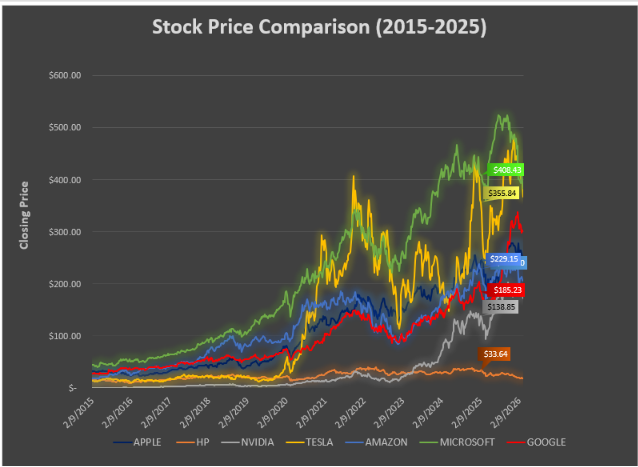
Line chart comparing seven tech stock closing prices from 2015 to 2025

All seven stocks on one chart

Project 5 · BA 215 · Business Spreadsheet Analysis

Tech Stock Performance, 2015–2025

ExcelTime-series chartsMarket data

Goal

Compare how seven large tech stocks performed over ten years.

What I did

Charted daily closing prices for Apple, HP, NVIDIA, Tesla, Amazon, Microsoft and Google, with one chart per company and a combined comparison.

Result

Microsoft reached the highest price at about $408, NVIDIA grew fastest after 2023, and HP stayed mostly flat near $30.